Aggregate with context
Collect web analytics, search, advertising, referral, content, product, and outcome data while preserving raw fields, grain, timezone, currency, and extraction context.
Open the architecture guideAggregateTraffic.com is a practical knowledge platform for web traffic aggregation, multi-source metrics, traffic data APIs, visitor analytics, attribution, funnels, dashboards, and benchmarks. It explains how to connect sources without hiding their differences.
Three foundations
A durable analytics program combines technical architecture, measurement discipline, and decision-ready interfaces.
Collect web analytics, search, advertising, referral, content, product, and outcome data while preserving raw fields, grain, timezone, currency, and extraction context.
Open the architecture guideExpose stable resources, dimensions, measures, freshness, quality, and definition versions through reusable dashboard and API contracts.
Design a traffic data APIUse relevant comparisons, visible data status, restrained visual hierarchy, and clear drill paths so teams can move from signal to investigation.
Build a better dashboard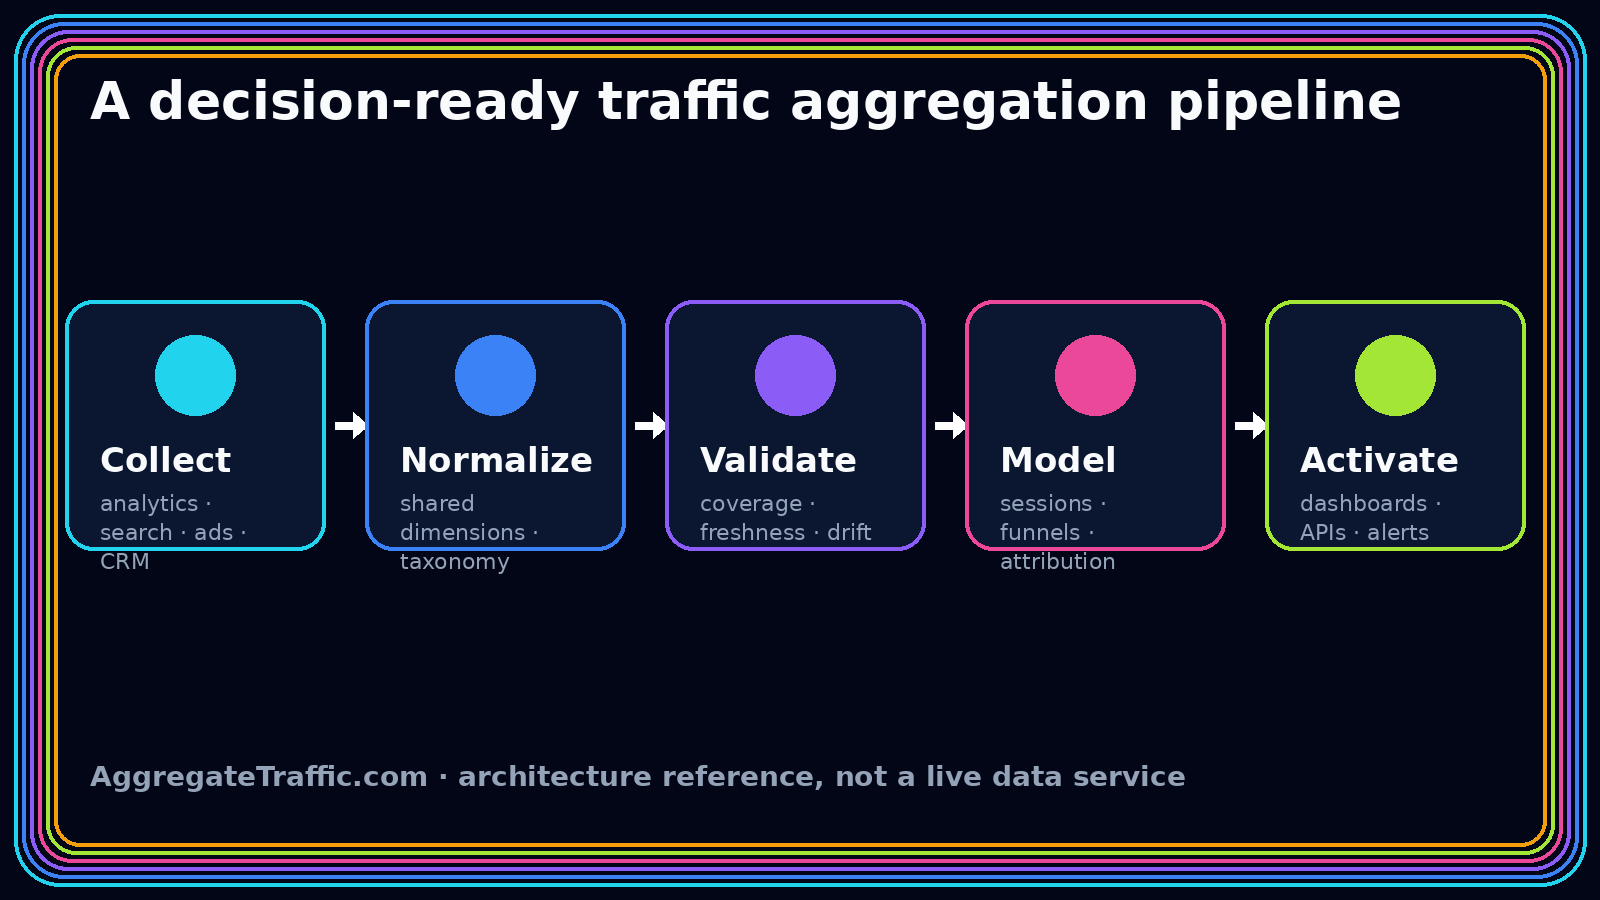
Multi-source architecture
Different systems count different moments. The objective is not to force clicks, sessions, impressions, events, and outcomes into one number. It is to connect them through explicit grains, shared dimensions, and visible quality controls.
Measurement controls
A number without reporting context can be precise and still be unsafe to use.
Coverage
Complete?
Expected sites, accounts, sources, and dates are present.
Freshness
Current?
Every resource declares its latest complete reporting period.
Lineage
Traceable?
A displayed metric can be followed to source and transformation.
Definition
Versioned?
Calculation and mapping changes have effective dates.
Core guide paths
Each guide owns a distinct search intent and links into the long-form research library.
Plan collection, validation, normalization, modeling, identity, privacy, and serving layers.
Platform blueprintDesign resource grains, query semantics, quality metadata, pagination, access, and versioning.
API guideBuild KPI hierarchy, relevant comparisons, anomaly context, and diagnostic workflows.
Dashboard guideConnect campaign taxonomy, channel views, attribution, organic, referral, funnels, and outcomes.
Marketing analytics guideUse internal baselines, matched cohorts, uncertainty, targets, and qualified external context.
Benchmarking guideRead ten complete implementation guides with custom visuals, structured metadata, and research paths.
Open the libraryIllustrative dashboard
A decision-ready dashboard pairs current values with relevant expectations and makes provisional or partial data difficult to overlook. The image is illustrative; the site does not connect to live visitor data.

Latest research
Original long-form guidance for analytics engineers, growth teams, marketing operations, content leaders, and decision makers.
How to build relevant internal and external traffic benchmarks using comparable cohorts, stable definitions, uncertainty ranges, and decision-focused review cycles.
Read field note
A practical framework for designing useful visitor analytics with clear purposes, data minimization, consent-aware collection, bounded identity, and retention controls.
Read field note
A guide to interpreting referral traffic, normalizing sources, understanding missing referrers, managing exclusions, and respecting browser privacy behavior.
Read field noteFrequently asked questions
Use these definitions as a starting point, then follow the linked guides for design detail.
Web traffic aggregation is the process of collecting and relating traffic measures from web analytics, search, advertising, referral, content, product, and business systems. A governed model preserves source-specific meaning while adding shared dimensions for comparison.
No. AggregateTraffic.com is an independent educational and technical reference. The static site does not include accounts, data connectors, dashboards connected to live sources, or server-side processing.
Tools can use different counting units, timezones, attribution windows, identity rules, privacy thresholds, filters, and processing schedules. A useful aggregation layer documents those differences and reconciles compatible grains rather than forcing artificial equality.
The first view should show the primary outcome, the most important drivers, a relevant comparison, and data status such as freshness and source coverage. Diagnostic breakdowns should be reachable without competing with the headline.
Use benchmarks as relevant reference points, not universal grades. Internal history, matched cohorts, experiments, targets, forecasts, and qualified external data each answer different questions and should keep their definitions and uncertainty visible.
Build from shared definitions
AggregateTraffic.com provides the architecture and measurement framework; implementation should apply it to the sources, users, obligations, and operating cadence in the actual environment.