Define the platform around decisions
Begin with a decision inventory rather than a connector list. Document the recurring questions the platform must support, who owns each decision, which action can follow, and how quickly the data must arrive. Examples include reallocating campaign spend, diagnosing an organic decline, validating a landing-page release, or explaining a change in qualified pipeline.
Each decision should name its measures and dimensions. Clicks, sessions, impressions, events, cost, and business outcomes describe different moments and should remain distinct even when they appear in one report. The aggregation layer connects those measures through explicit grains and keys rather than renaming all of them as traffic.
Use a layered data architecture
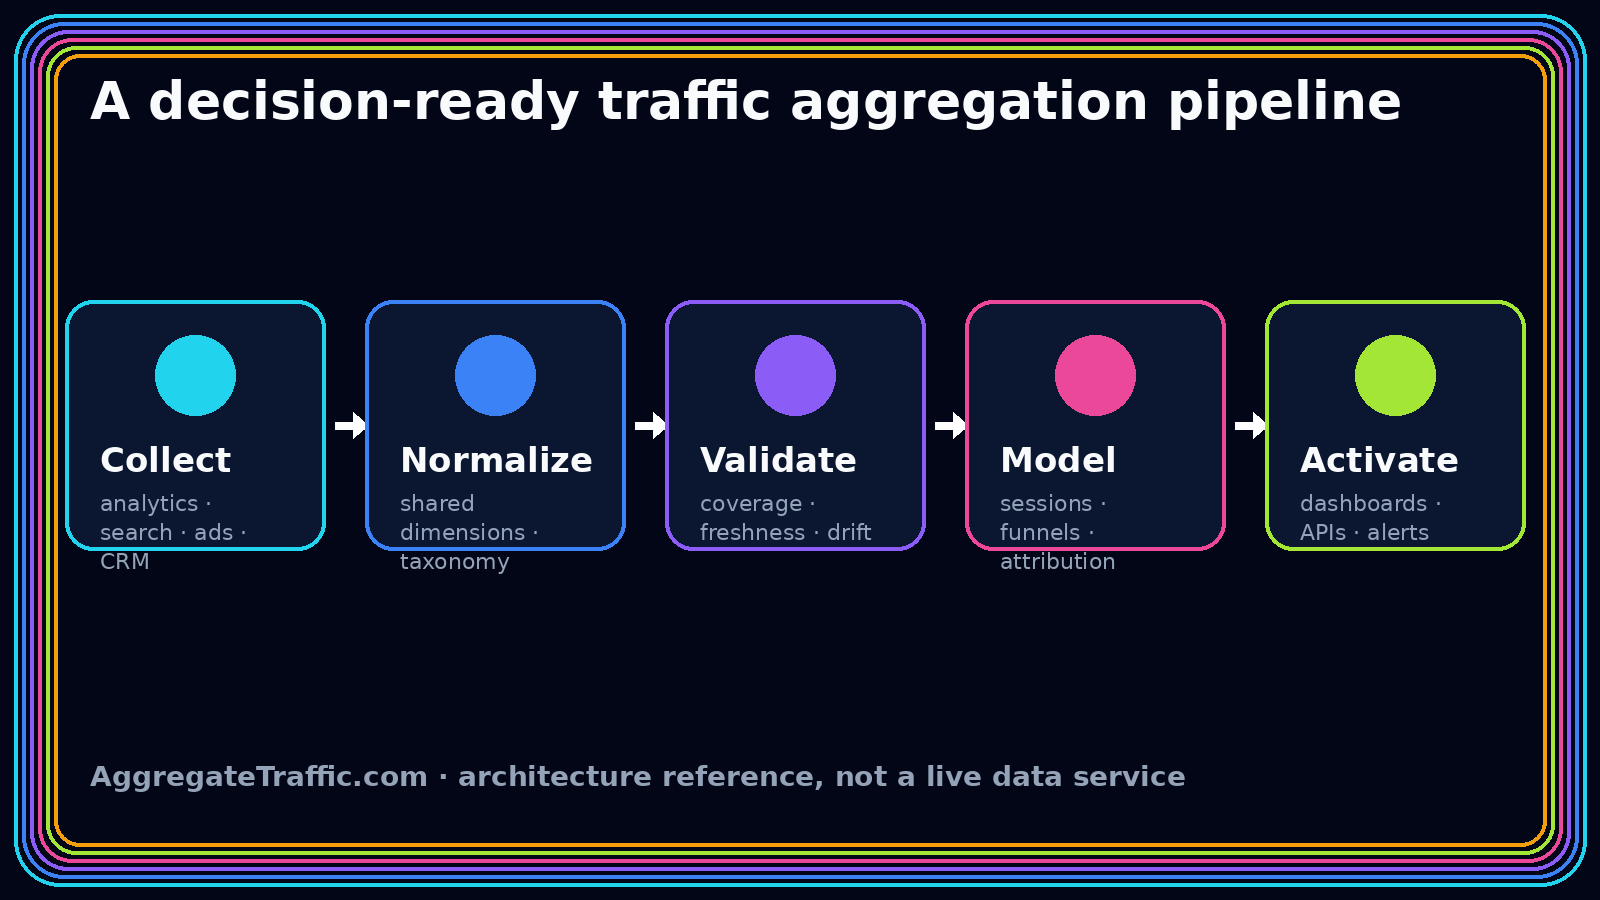
A durable platform separates ingestion, validation, normalization, modeling, and serving. Ingestion captures source data with extraction metadata and minimal transformation. Validation checks schema, completeness, duplicate keys, volume, and freshness. Normalization adds canonical dimensions while preserving raw fields. Modeling creates decision-oriented facts and relationships. Serving exposes stable tables, dashboards, and APIs.
| Layer | Responsibility | Evidence retained |
|---|---|---|
| Ingestion | Capture source records and request context. | Endpoint, account, reporting window, load time. |
| Validation | Detect missing, malformed, duplicated, or delayed data. | Test result, expected range, exception owner. |
| Normalization | Apply shared dimensions and mappings. | Raw value, canonical value, mapping version. |
| Modeling | Define grains, joins, funnels, and outcomes. | Transformation and metric definition lineage. |
| Serving | Deliver governed data to people and systems. | Freshness, quality, and definition metadata. |
Build a canonical traffic model
The shared model commonly needs calendar, site or property, source platform, channel, campaign, content or landing page, geography, device, and outcome dimensions. Every field needs a type, owner, null rule, and allowed values. Stable identifiers should be keys; display names should remain descriptive attributes.
Keep measures at their natural grain until a defined analysis requires aggregation. Search data may be available by query and page, cost by campaign and day, web data by event or session, and CRM outcomes by contact or account. Test whether a measure remains additive after every join.
- Preserve source account, property, campaign, and content identifiers.
- Normalize URLs with documented host, path, redirect, and parameter rules.
- Store timezone and currency context with every affected fact.
- Version channel and campaign mappings instead of editing history silently.
Make quality and lineage visible
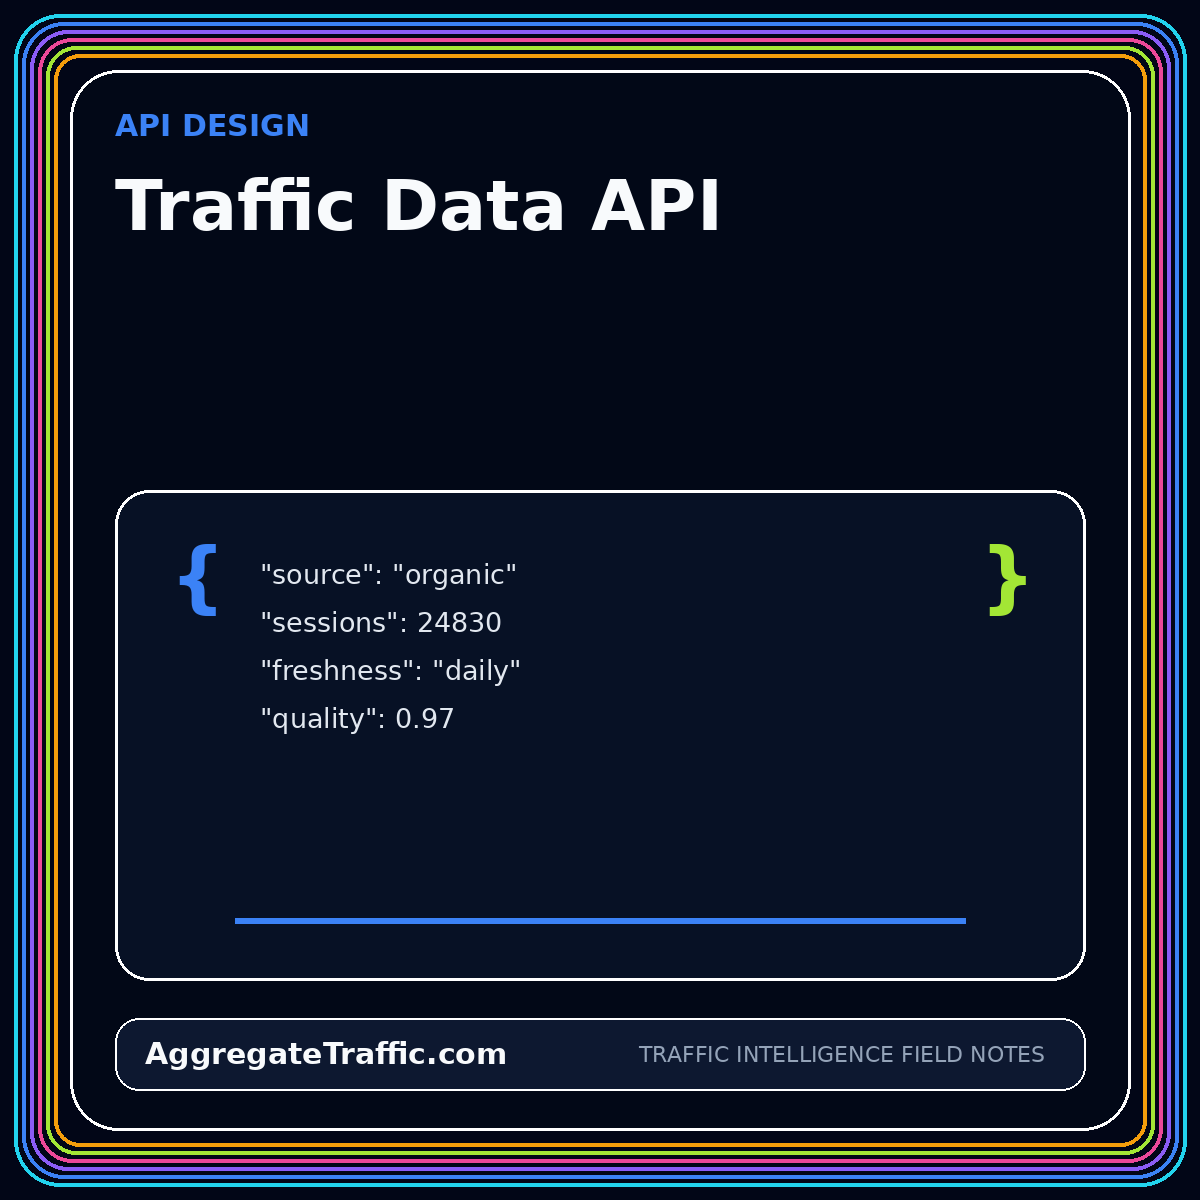
Consumers should not need pipeline access to know whether a metric is current. Expose data-through timestamps, expected source coverage, reconciliation status, mapping exceptions, and known limitations in the dashboard or API response. Missing sources should create a clear partial-data state rather than a plausible but incomplete total.
Lineage connects a displayed number to the extraction, raw table, validation result, transformation, and definition that produced it. When a platform interface and the aggregate model disagree, lineage provides a path to test timezones, filters, attribution rules, thresholds, and mapping behavior.
Use bounded identity and privacy controls
A browser session, advertising click, authenticated user, company account, and CRM record are different entities. Model those relationships explicitly and distinguish deterministic links from inferred ones. Many useful questions can be answered with page, campaign, channel, geography, and cohort data without constructing a universal person profile.
Apply purpose limitation, minimization, role-based access, retention schedules, and consent-aware collection. Keep sensitive mappings in a restricted layer. Most dashboard and API consumers should receive aggregates with no direct identifiers.
Activate through shared contracts
Publish a semantic contract used by dashboards, APIs, exports, and automated summaries. Metric names, filters, date logic, channel mappings, freshness states, and quality warnings should remain consistent across interfaces. This prevents each report from rebuilding its own version of sessions, qualified traffic, or conversion rate.
Begin with one decision and a limited source set, reconcile it, then add complexity. A useful first release may combine campaign cost, web sessions, and a qualified outcome for one region. Expand only after the team can explain every field, trace discrepancies, and operate the quality controls.